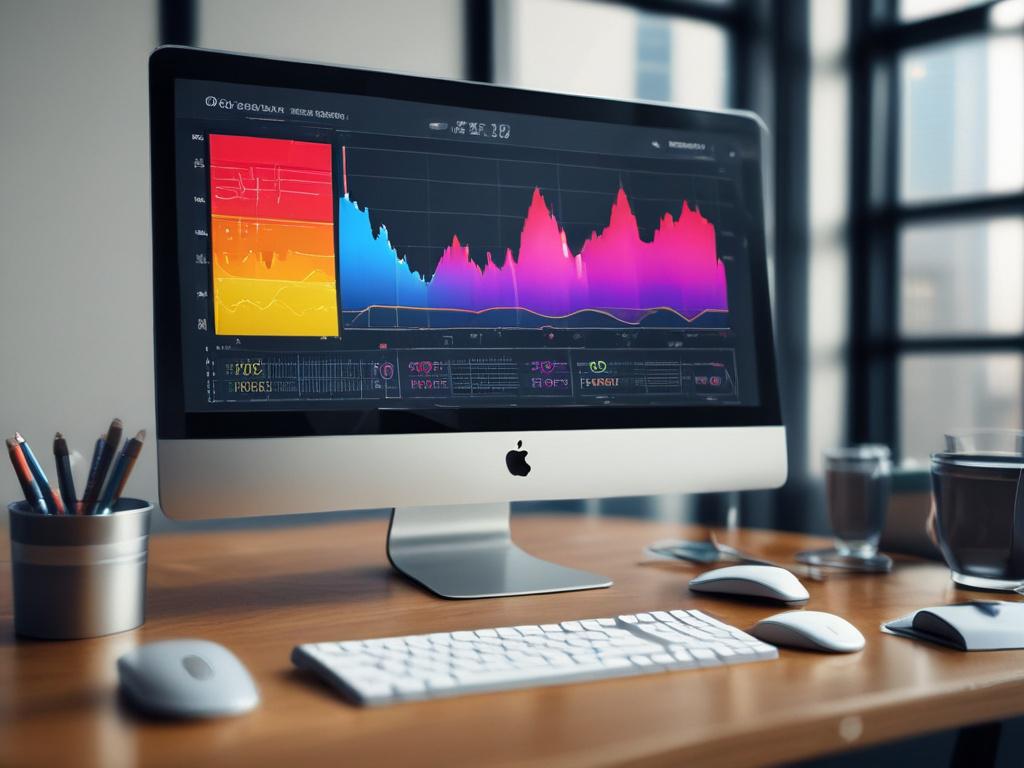
Data visualization
Data visualization is the art of presenting data in a visual format that enhances understanding and engagement. I create dynamic visuals that illustrate complex data sets clearly and effectively, enabling stakeholders to grasp insights quickly. Using tools such as Tableau and Power BI, I design interactive dashboards that allow users to explore data trends and patterns intuitively. My approach combines design principles with analytical rigor to produce visuals that not only inform but also inspire action. I strive to make data accessible and engaging, transforming numbers into narratives that drive decision-making and strategic planning.

Let's talk
We would love to hear from you!